
Don't Guess Your System: Measure It and Tune It
Which job peaks when, how much resource does each container need, what happens at the next load spike? RiverAI leaves none of this to guesswork: it shows the load hour by hour, simulates it with What-if scenarios, and lets you apply the AI-recommended resource placement with a single click.
See Your Load Hour by Hour
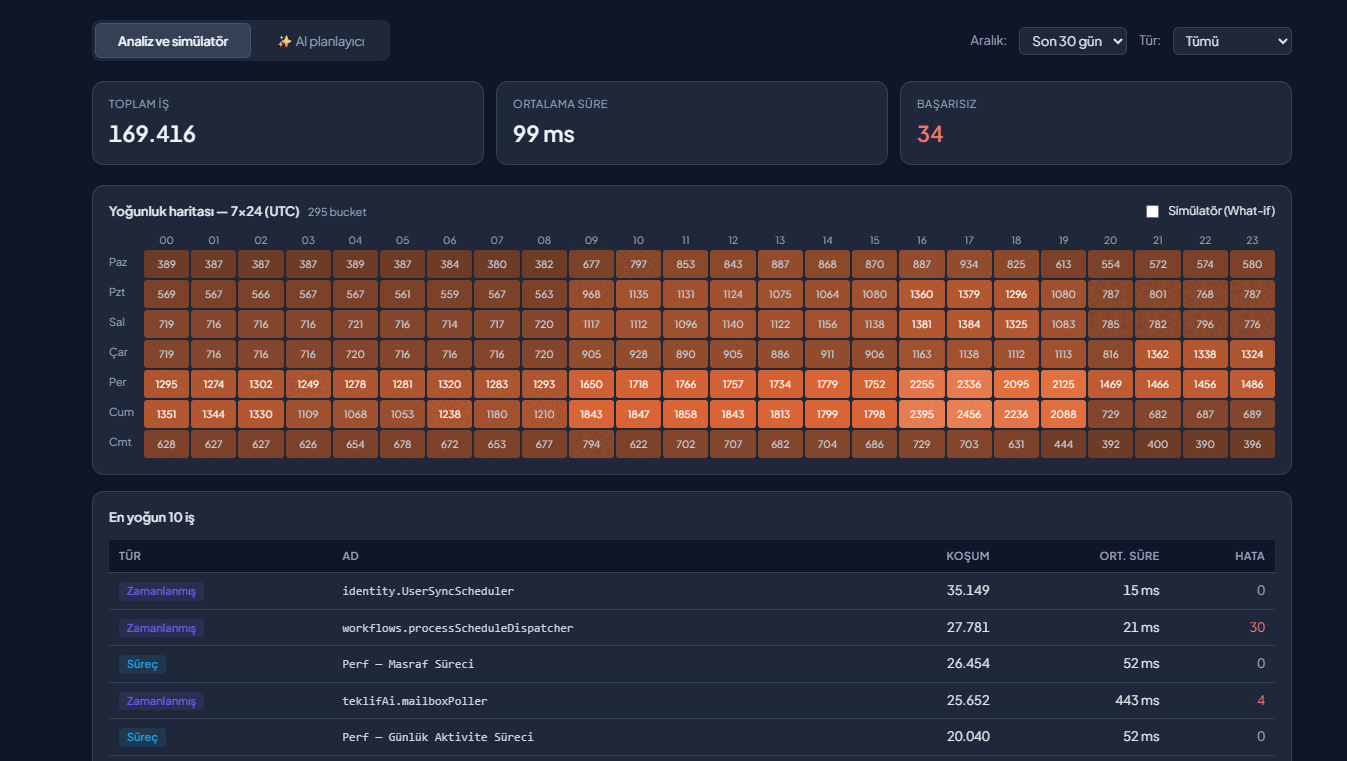
The Performance Tuning screen gathers the real execution data of every job in the system in one place: total run count, average duration, and failed job count sit at the top as summary cards, while below them a 7×24 heatmap shows the load for every day of the week and every hour using color intensity. That way you catch patterns like "the system hits its busiest moments on Thursday and Friday afternoons" at a glance.
You also see which job is pulling the load: the busiest jobs are listed with run count, average duration, and error rate; if a scheduled task is taking longer than expected or throwing errors, it stands out immediately. With the What-if simulator, you can try scenarios like "what happens if this job's load doubles" without touching the live system and watch the result play out on the heatmap in real time.
AI Plans Your Resources for You
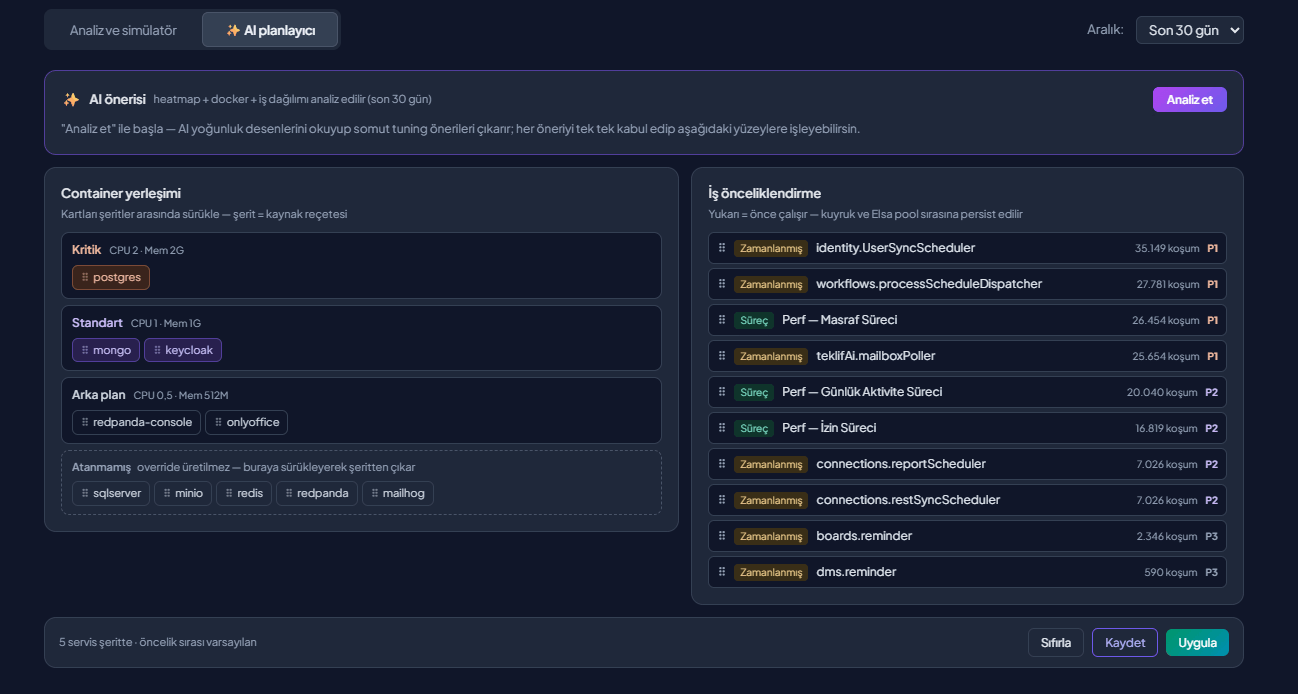
Reading the heatmap is one thing; allocating resources accordingly is another. The AI Planner takes on that second step: it analyzes load patterns, container distribution, and job intensity together, then produces concrete tuning recommendations. It places services into criticality bands (more CPU/memory for critical services like the database, less for background services) and you can accept and apply each recommendation individually.
Jobs are queued by priority, not blindly: critical jobs such as identity synchronization and process triggers are marked P1, while jobs that can wait (reporting and reminders) are marked P2/P3; this priority order is persisted to the queue and the worker pool. You first save the changes as a draft and review them, then put them into effect with "Apply" when you are ready.
- 7×24 Heatmap: the load for every hour of the week is visible as color intensity; patterns rest on data, not guesswork.
- What-if Simulation: try load-spike scenarios without touching the live system and see the result in real time.
- AI Resource Placement: services receive CPU/memory according to criticality bands; each recommendation is applied with a single click.
- Job Prioritization: critical jobs are P1, those that can wait are P2/P3; the priority order is persisted to the queue and the worker pool.
Everything You Need for Tuning
Live Load Visibility
Total runs, average duration, and error rate; hourly patterns via the 7×24 heatmap.
What-if Simulation
Try load-spike scenarios without touching the live system and see the result instantly.
AI Resource Planning
Containers receive CPU/memory according to criticality bands; recommendations are applied with one click.
Job Prioritization
The P1/P2/P3 priority order is persisted to the queue and the worker pool.
Let's Tune Your System Together
In a 15-minute demo, let's analyze your own workload and see the AI-recommended resource placement live.
Request a Demo